http://www.fastcodesign.com/1663552/infographic-of-the-day-the-inequality-of-americaThe rich are getting richer at a pace that leaves everyone behind. And in the long run, that threatens our democracy.
You might not know it, with all the progress we've made as a society in the past 100 years (our first black president, for instance), but America is still an incredibly unequal place. The gaps between classes, sexes, and races are--in many ways--actually getting worse, and the gap between the rich and the poor is larger than at any time in the last 75 years.
This graphic illustrates just a few of the quantifiable ways that our society manifests these various inequalities.
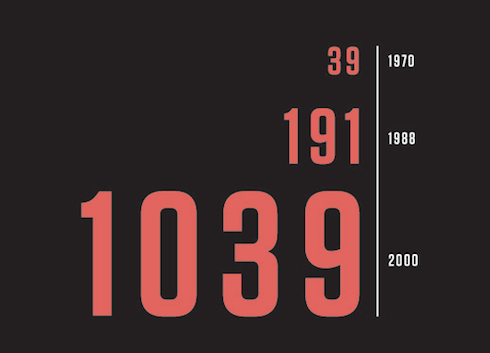
Taken from information provided by The Stanford Center for the Study of Poverty and Inequality, the graphic--by Kristy Tillman for Objects in Repeat--explains 15 different facts about American inequality that might tweak your worldview a little. For instance, did you know that the average CEO's pay is 1,039 times more generous than that of the average worker?
 And it's not as if we've always lived that way. Forty years ago, CEOs were only being paid 39 times that of the average worker. Some companies these days are tying CEO pay to the pay of the least compensated employee at the same company. Clearly not that many.
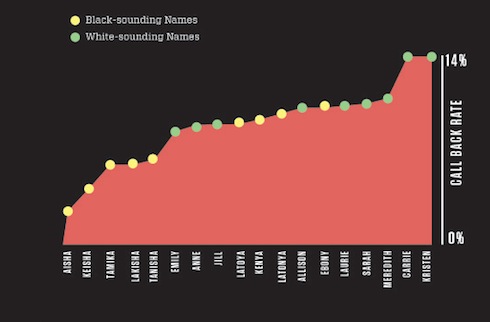
Or look at the results of a study done in Chicago and Boston in 2001 and 2002: Job applicants with "black" sounding names were far less likely to be called in for job interviews (this was back when there were jobs to interview for):
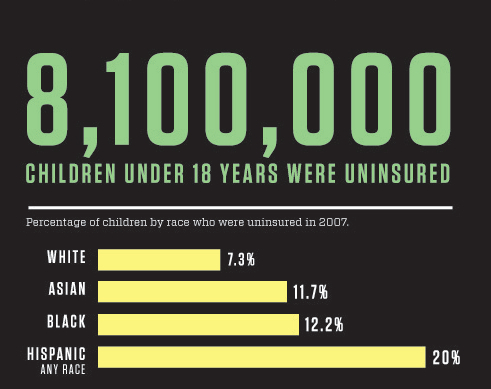
 Looking for a job? Consider changing your name to Kristen or Carrie on your resume. That wouldn't help your insurance situation, though. Children of minorities are far more likely to live without health insurance:
 What else? Women also make less than men (though this is improving!) and jobs with higher pay have a smaller percentage of women working at them. Minorities are far more likely to drop out of school, and immigrants are far less likely to receive an education. And though GDP has risen, wages have remained stagnant (except for those CEOs), which has contributed to the top 10% of the wealthiest Americans controlling nearly three-quarters of all the money in America.
Taken individually, there are potential statistical and cultural reasons to explain away each of these stats. Arranged in this order, it's hard not to realize we need to do better to give everyone a little bit more of an even playing field.
You might not know it, with all the progress we've made as a society in the past 100 years (our first black president, for instance), but America is still an incredibly unequal place. The gaps between classes, sexes, and races are--in many ways--actually getting worse, and the gap between the rich and the poor is larger than at any time in the last 75 years.
This graphic illustrates just a few of the quantifiable ways that our society manifests these various inequalities.

Or look at the results of a study done in Chicago and Boston in 2001 and 2002: Job applicants with "black" sounding names were far less likely to be called in for job interviews (this was back when there were jobs to interview for):


Taken individually, there are potential statistical and cultural reasons to explain away each of these stats. Arranged in this order, it's hard not to realize we need to do better to give everyone a little bit more of an even playing field.
You have read this article study
with the title Infographic of the Day: 15 Facts About America's Income Inequality. You can bookmark this page URL http://emill-emil.blogspot.com/2011/04/infographic-of-day-15-facts-about.html. Thanks!


